
Volume 3, Issue 5, 2025
Editorial
Evolving Challenges in Modern Qualitative Research
Snur Othman
Qualitative research works at revealing the depth of human experiences, cultural nuances, and complex social dynamics, yet it confronts formidable challenges including pervasive researcher subjectivity, methodological inconsistencies, ethical intricacies, resource burdens, data management overload, and struggles with establishing rigor and transferability that often invite skepticism from quantitative paradigms. These obstacles not only complicate the research process but also threaten the perceived validity and broader applicability of findings in fields like health, education, and social sciences. Addressing them requires deliberate strategies to fortify qualitative inquiry's contributions to knowledge [1].
Subjectivity and Researcher Bias
The interpretive essence of qualitative research inherently invites researcher bias, as personal worldviews, cultural backgrounds, and preconceptions influence every stage from question formulation to data interpretation. For example, during thematic analysis of interviews, a researcher's emphasis on certain participant quotes might overlook contradictory evidence, leading to unbalanced narratives. Mitigation strategies like reflexivity where researchers explicitly document their influences and triangulation, cross-verifying data from multiple sources, prove essential, though full elimination of subjectivity remains impractical in this paradigm [2].
Methodological Design and Rigor Hurdles
Crafting a robust qualitative design demands precise alignment between philosophical underpinnings, research questions, and methods such as phenomenology, grounded theory, or discourse analysis, yet mismatches frequently occur due to insufficient expertise. Determining data saturation when new data yields no fresh insights relies on subjective judgment, complicating claims of completeness, while ensuring transferability to other contexts necessitates detailed "thick descriptions" of participants and settings. In health research, these issues amplify without clear audit trails, prompting calls for standardized rigor criteria akin to quantitative benchmarks [3].
Data Collection and Management Complexities
Gathering qualitative data through prolonged interviews, focus groups, or ethnographies generates vast, unstructured volumes of transcripts, field notes, and multimedia that overwhelm storage, organization, and preliminary sorting. Logistical barriers, like recruiting hard-to-reach participants or adapting to virtual formats, further delay progress, while ensuring consistency across sessions proves elusive without rigid protocols. Digital tools offer relief for transcription and initial coding, but they demand technical proficiency and risk diluting contextual richness if misapplied [1-4].
Analysis and Interpretation Demands
Transforming raw qualitative data into coherent themes involves iterative coding, pattern identification, and narrative synthesis, a labor-intensive process prone to interpretive drift among team members. Balancing depth with transparency challenges researchers, especially when handling ambiguous or contradictory data, and emerging AI aids accelerate this but introduce concerns over algorithmic bias eroding human insight. Peer debriefing, inter-coder reliability checks, and software like NVivo enhance trustworthiness, yet the time investment often months strains projects and underscores the need for advanced training [4].
Ethical, Practical, and Interdisciplinary Tensions
Ethical navigation intensifies in qualitative work due to intimate participant interactions, raising issues like securing ongoing consent, safeguarding anonymity in sensitive topics, and managing power imbalances with vulnerable groups. Practical constraints, including high costs for fieldwork and participant fatigue, compound these, while interdisciplinary skepticism particularly from STEM fields questions replicability and generalizability. Mixed-methods integration and decolonial approaches that center marginalized voices offer bridges, but they require institutional support and evolved review board processes [5].
Emerging Trends and Solutions
Technological innovations like AI-driven analysis and big data integration promise efficiency, yet they challenge traditional methodological purity and amplify ethical risks around data privacy. Postqualitative and indigenous methodologies push boundaries by rejecting linear processes, fostering inclusivity amid globalization. Researchers advance by prioritizing comprehensive training, open-access protocols for auditability, and collaborative networks to elevate qualitative work's stature and impact.
Original Articles
Could first-trimester bleeding affect a newborn's Apgar score?
Leila Sekhavat, Atiyeh Javaheri
Introduction
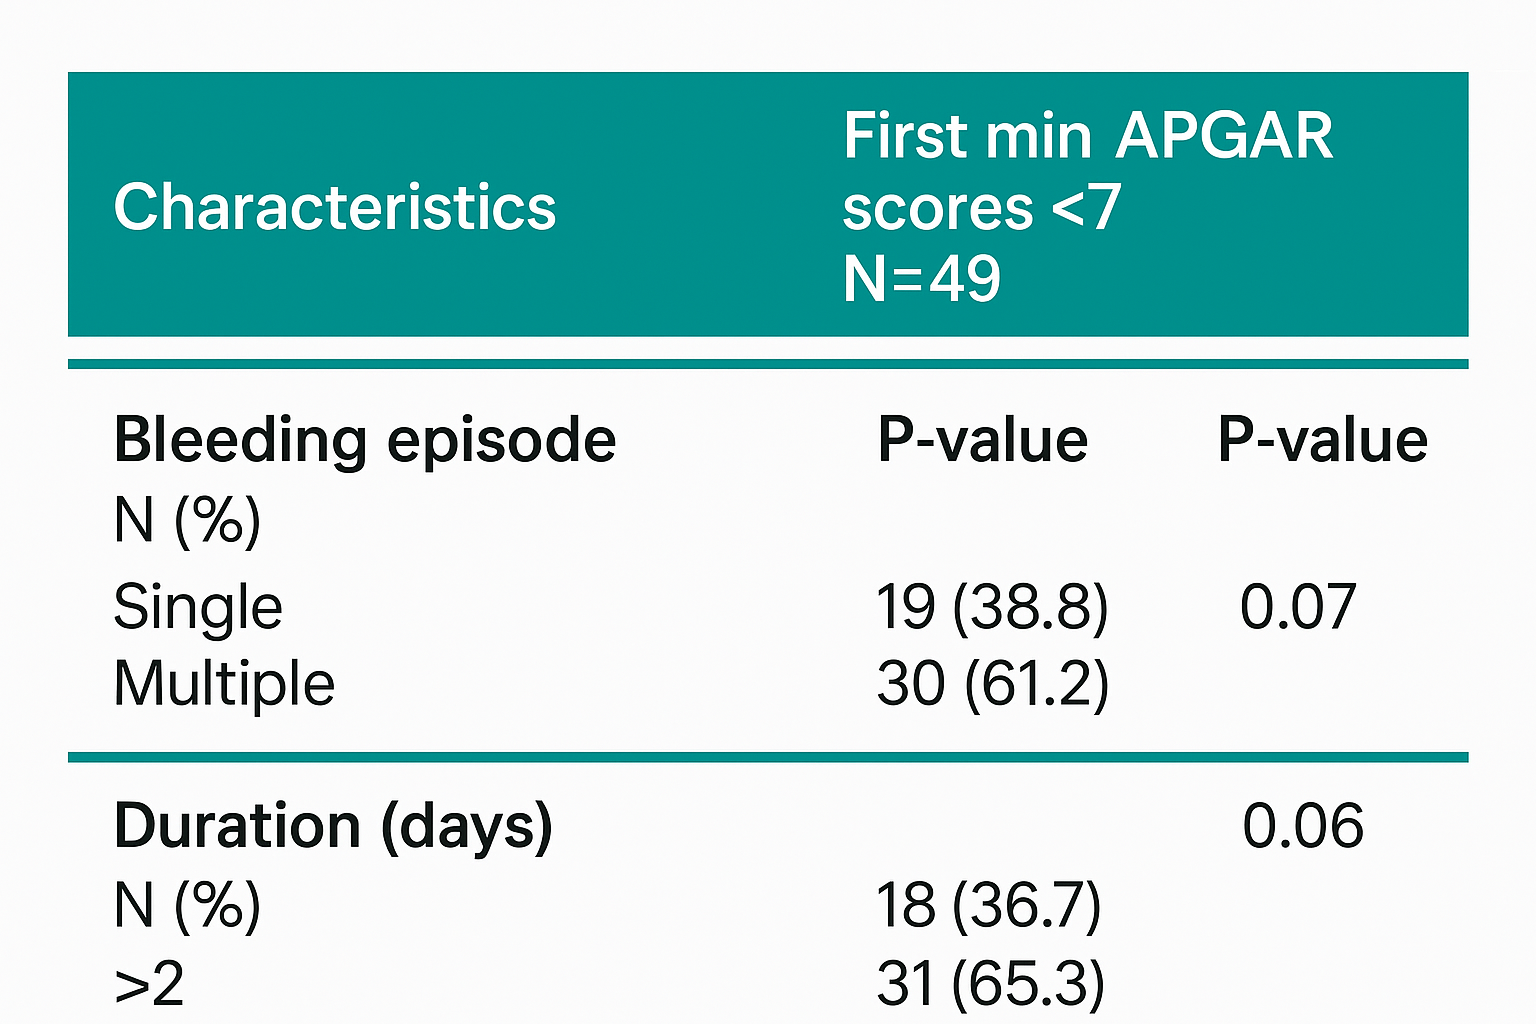
Vaginal bleeding is a common complication during pregnancy and may contribute to adverse pregnancy outcomes. This study aimed to evaluate the effect of first trimester bleeding on newborns Apgar scores.
Methods
A retrospective study was conducted on pregnant women who delivered at Shahid Sadoughi hospital in Yazd, Iran, between 2022 and 2023. Only singleton, nulliparous, non-diabetic women were included. Participants were divided into two groups: the exposure group (Bleeding Group) and control Group (Non-Bleeding Group), based on archived records. Apgar scores recorded at the first and fifth minutes after birth in newborns file were compared between groups.
Results
A total of 992 women were included, with 218 in the exposure and 774 in the control groups. The incidence of a first-minute Apgar score <7 was significantly higher in the bleeding group compared to controls (22.5% vs. 6.2%, p = 0.02). However, there was no significant difference in five-minute Apgar scores between groups.
Conclusion
This study demonstrated a positive association between first-trimester vaginal bleeding and a low first-minute Apgar score in newborns.
Impact of Common Anticoagulants on Complete Blood Count Parameters Among Humans
Rawezh Q. Salih, Dahat A. Hussein, Sharaza Q. Omer, Shvan L. Ezzat, Ayman M. Mustafa, Hawnaz S....
Introduction
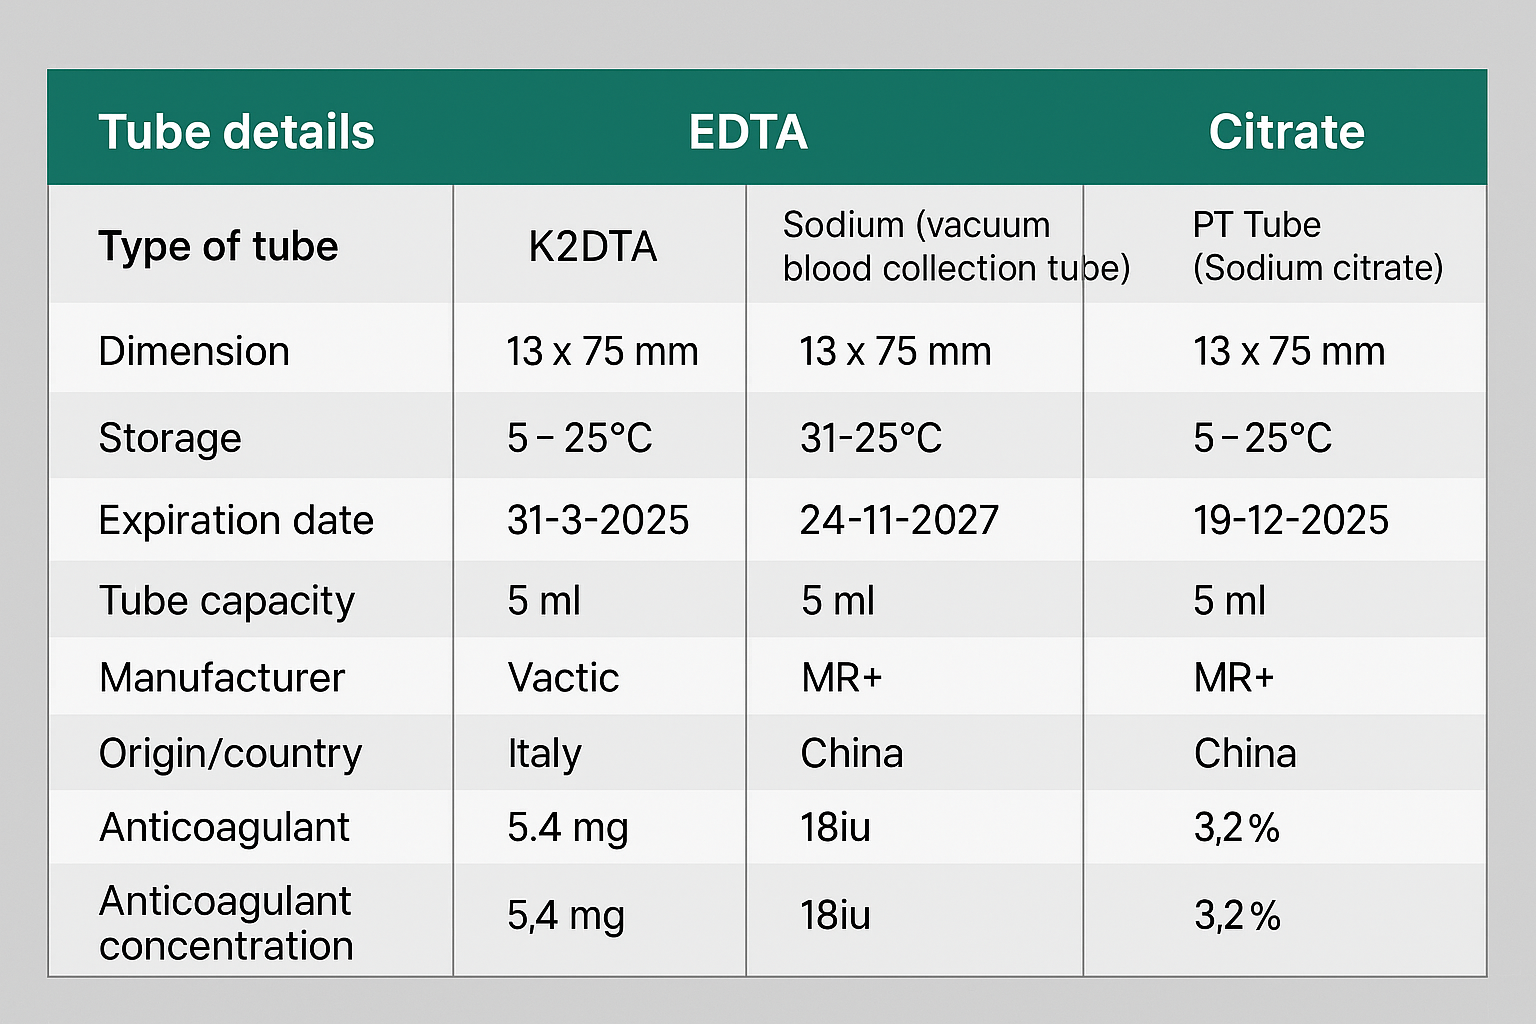
Among the most frequently used anticoagulants in hematological testing are tetra-acetic acid (EDTA), sodium citrate, and sodium heparin. However, there is a noticeable gap in literature concerning the effects of these anticoagulants on hematological parameters specifically in humans. This study aims to assess the effectiveness of EDTA, sodium citrate, and sodium heparin for conducting complete blood count (CBC).
Methods
This cross-sectional study conducted at Smart Health Tower from January to April 2024 involved 250 participants who underwent CBC using K2EDTA, sodium citrate, and sodium heparin. The acquired data were analyzed using SPSS, with a significance level of p < 0.05, employing Intra-class correlation coefficient and one-way ANOVA to assess consistency and agreement among anticoagulants.
Results
A total of 250 participants, with 138(55.2%) males and 112(44.8%) females, underwent CBC testing with di potassium EDTA(K2EDTA), sodium citrate, and sodium heparin. Comparing K2EDTA with sodium heparin showed comparable values in 14 out of 23(60.87%) CBC parameters. Using K2EDTA as the standard, citrate showed perfect or substantial agreement in assessing 8 out of 23 CBC parameters (34.78%). Regarding the comparison of anticoagulants to K2EDTA to determine their agreement levels while sodium heparin was accurate and precise in 13(56.52%) parameters.
Conclusion
Citrate was found to be a less reliable anticoagulant for CBC estimation compared to K2EDTA, potentially leading to inaccurate readings. On the other hand, sodium heparin showed comparable performance to K2EDTA, making it a suitable alternative under specific conditions.
Exploring the Efficacy of Once and Twice Weekly Thyroxine Dosing: A Promising Approach for Hypothyroidism Management
Abdulwahid M. Salih, Aso S. Muhialdeen, Mohsin M. Ahmed, Hardi M. Zahir, Yadgar A. Saeed,...
Introduction
Hypothyroidism is a common endocrine disorder, in which the management involves daily intake of thyroxine. However, adherence to a daily medication regimen poses a substantial challenge for many patients. The current study aims to assess the efficacy of once and twice-weekly thyroxine regimen for the management of hypothyroidism.
Methods
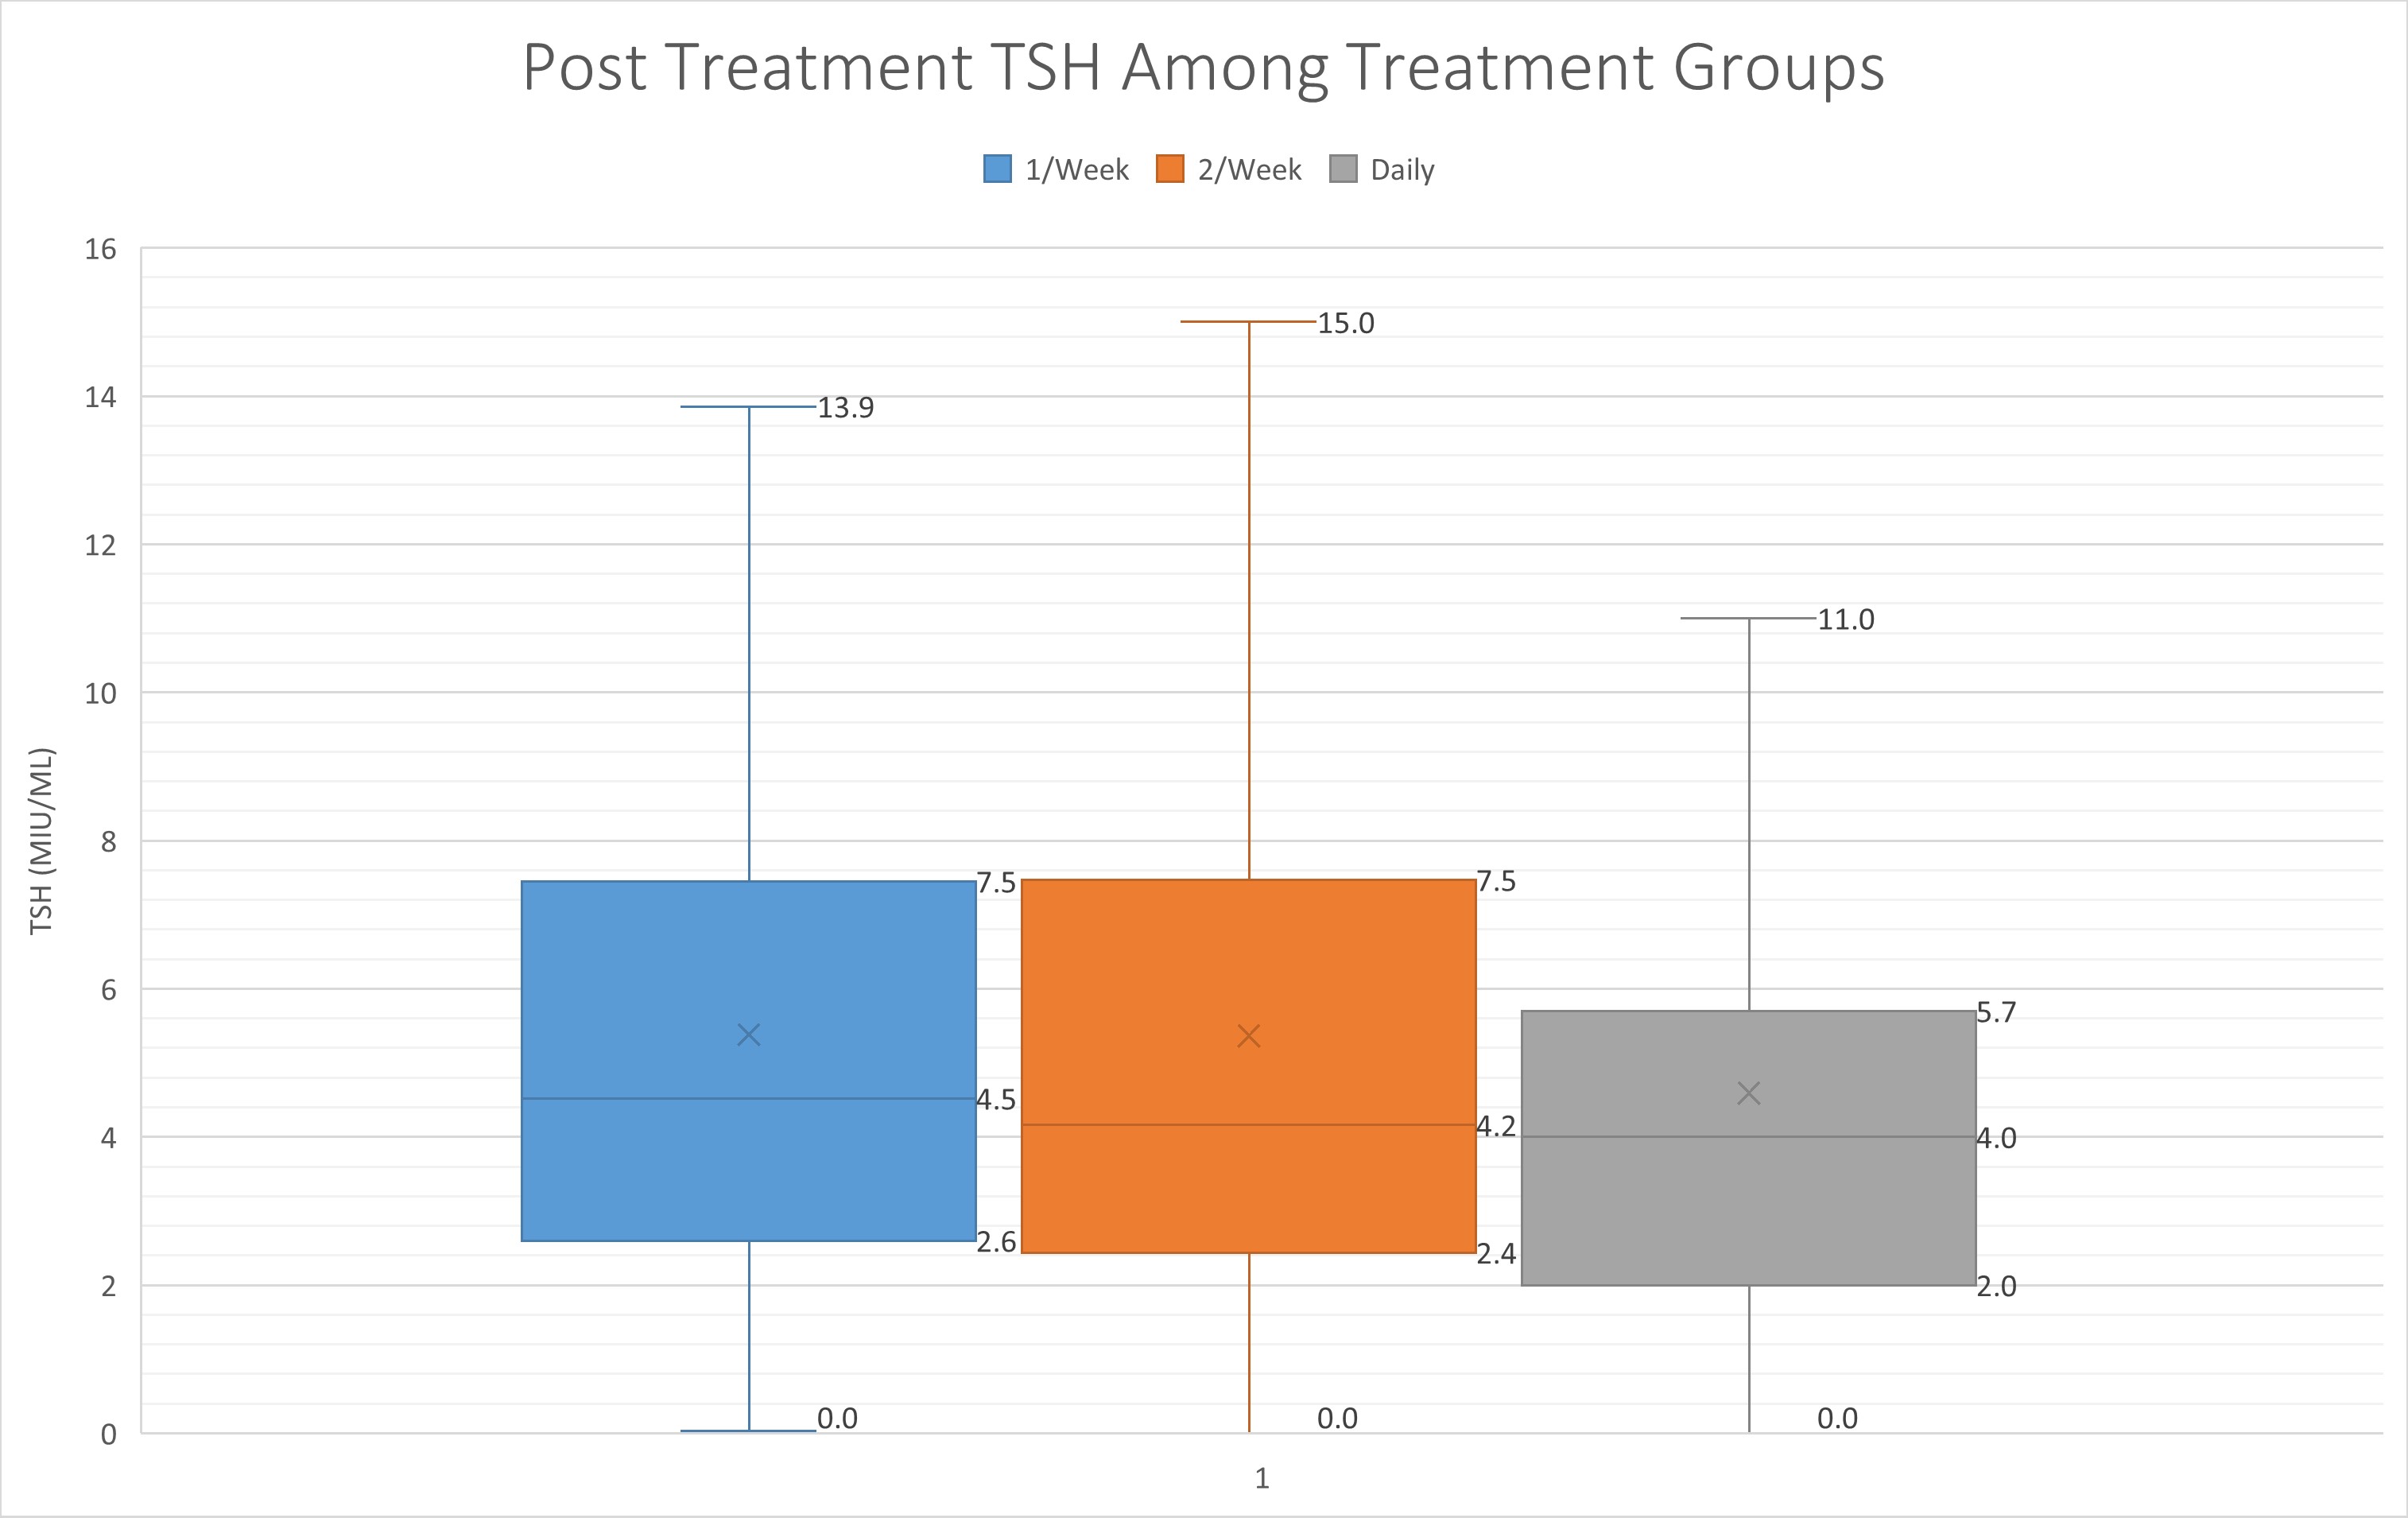
This was a single-center cohort study involving hypothyroid patients that was conducted over three years. In this study, standard daily, once and twice-weekly thyroxine dosing regimens were used to treat the patients. The effectiveness of the three dosage regimens was ascertained by whether the patients achieved a euthyroid state after six months of therapy.
Results
In total, 328 hypothyroid cases due to thyroiditis were included in this study. The average age of the cases was 42.7 years (14-92). Before thyroxine therapy, in the standard daily regimen group, the median level of TSH was 15.4 μIU/mL (IQR 23.1), in the once-weekly regimen group, the level was 9.2 μIU/mL (IQR 6.8), and in the twice-weekly regimen group, the level was 9.1 μIU/mL (IQR 7.3). After thyroxine intake and upon follow-up after 6 months, the TSH level decreased to 4.0 μIU/mL (IQR 3.7), 4.5 μIU/mL (IQR 4.9) and 4.2 μIU/mL (IQR 5.1) in the standard daily, once- and twice-weekly regimen groups, respectively.
Conclusion
Once and twice weekly thyroxine shows promise as strategies for managing hypothyroidism. However, variability in patients in response to weekly thyroxine needs to be taken into account.
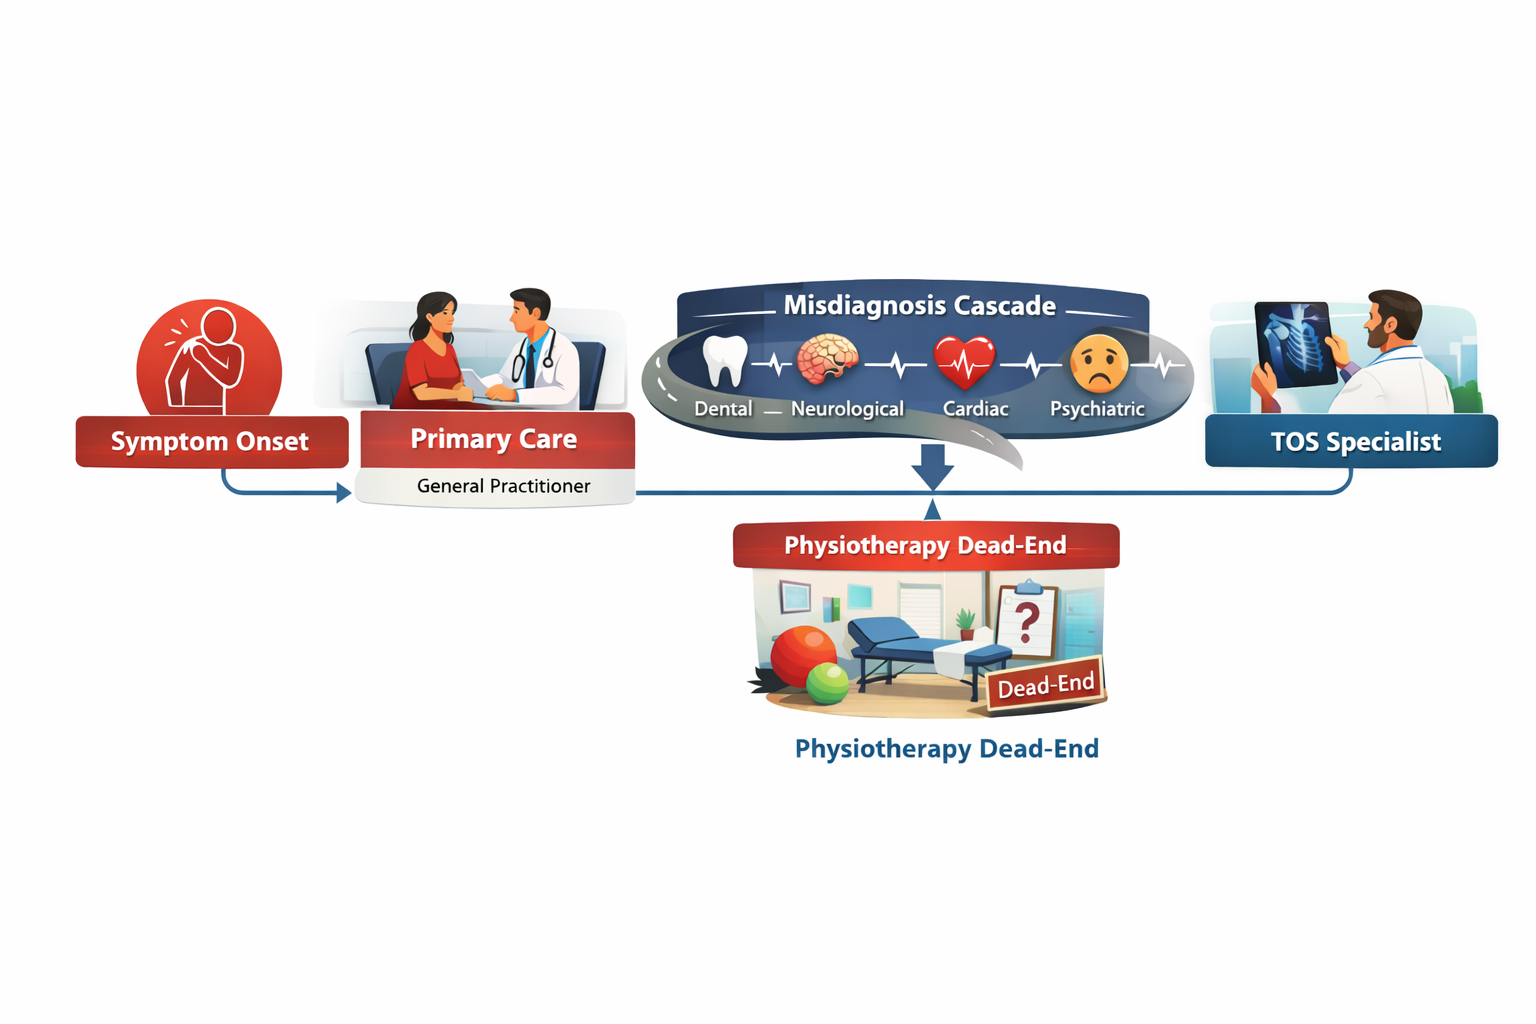
Suffering of Patients with Neurogenic Thoracic Outlet Syndrome (TOS); The First Qualitative study in TOS
Fahmi H. Kakamad, Shvan H. Mohammed, Berun A. Abdalla, Saywan K. Asaad, Abdullah K. Ghafour,...
Background
Diagnosis of neurogenic thoracic outlet syndrome (nTOS) is hindered by symptom overlap with cervical radiculopathy, carpal tunnel syndrome, or psychosomatic disorders. This challenge is further compounded by often normal imaging and electrodiagnostic findings, resulting in prolonged diagnostic suffering encompassing emotional, financial, and social burdens.
Objectives
This first qualitative study explores narratives from 25 diagnosed women initially prescribed physiotherapy: (1) identify key themes related to diagnostic challenges; (2) examine the psychological and emotional impact of diagnostic delay; and (3) propose a patient-centered diagnostic framework.
Methods
Qualitative descriptive design using semi-structured interviews (20-30 minutes) with purposive sampling from a TOS clinic (inclusion: confirmed nTOS, >1-year symptoms, no prior surgery; Data saturation was achieved after 22 interviews). Braun and Clarke’s reflexive thematic analysis generated 1,247 inductive codes, which were organized into four themes and twelve subthemes. NVivo software was used for data management. Member checking was conducted, and reporting followed COREQ guidelines. Ethical approval was obtained, and participant anonymity was preserved through pseudonyms.
Results
Four overarching themes emerged: (1) Fragmented Diagnostic Odyssey, characterized by multiple referrals (mean six clinicians per patient) and substantial out-of-pocket costs (USD 1,000–1,500); (2) Cascade of Misdiagnoses, including somatic mimics, invasive investigations, and prolonged incorrect treatment; (3) Social and Familial Invalidation, involving medical dismissal and pressure toward psychiatric explanations; and (4) Profound Emotional Suffering, with isolation and hopelessness identified in 84% of transcripts. A conceptual model was developed to illustrate the cumulative diagnostic journey.
Conclusion
Neurogenic thoracic outlet syndrome is associated with multilayered diagnostic and social invalidation consistent with the stigma of invisible illness. Improving outcomes requires enhanced clinician awareness of nTOS-specific red flags, validation of patient narratives, and multidisciplinary diagnostic pathways to reduce delays, prevent iatrogenic harm, and alleviate psychological distress.
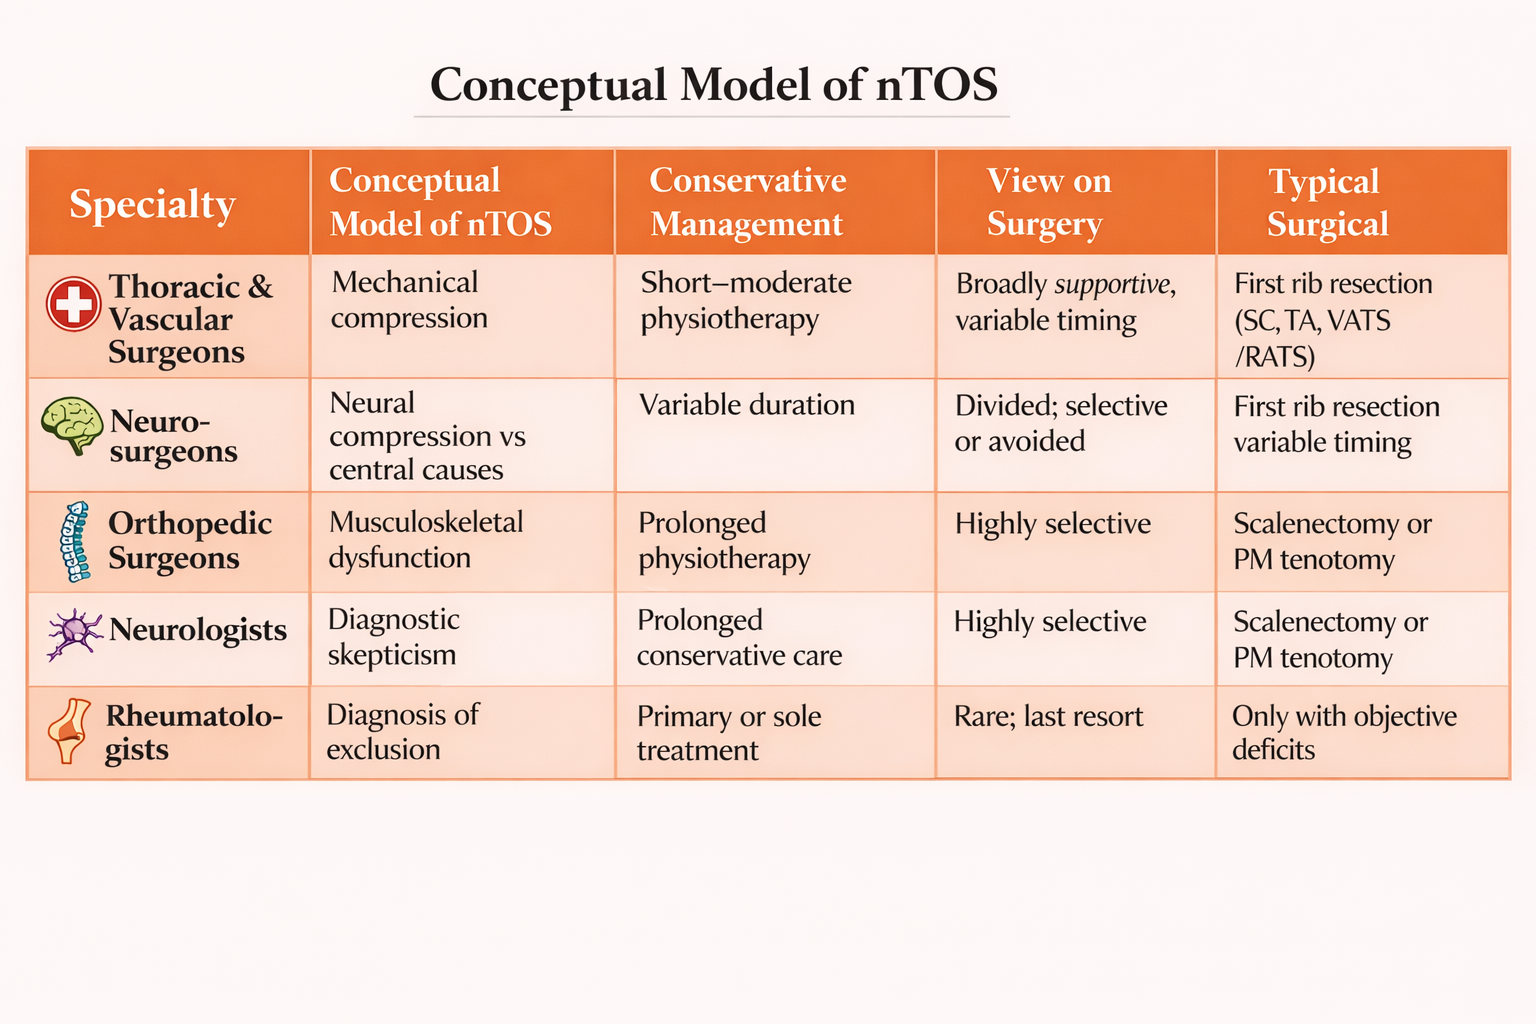
Divergent Conceptualizations and Management Strategies for Neurogenic Thoracic Outlet Syndrome: A Qualitative Multispecialty Study
Fahmi H. Kakamad, Saywan K. Asaad, Abdullah K. Ghafour, Azad Star Hattam, Lawand Ahmed Sharif,...
Background
Neurogenic thoracic outlet syndrome (nTOS) is the most prevalent subtype of thoracic outlet syndrome and remains one of the most controversial conditions in peripheral nerve and thoracic disorders. Despite widespread recognition of conservative therapy as initial management, substantial variation exists across medical specialties regarding diagnosis, duration of nonoperative treatment, and indications for surgery. These discrepancies suggest underlying differences in how nTOS is conceptualized rather than disagreement over available treatment options.
Objectives
This study aimed to explore and compare the perspectives of different medical specialties on the management of confirmed nTOS, with particular attention to conservative therapy, surgical indications, and underlying explanatory models.
Methods
A qualitative descriptive study was conducted using semi-structured interviews with 40 physicians from five specialties involved in nTOS care: thoracic and vascular surgery, neurosurgery, orthopedic surgery, neurology, and rheumatology (eight participants per specialty). Participants were recruited using purposive sampling based on clinical experience with nTOS. All interviews centered on a standardized question addressing management strategies following confirmation of nTOS. Data were analyzed using reflexive thematic analysis.
Results
Five overarching themes emerged. All specialties endorsed physiotherapy as first-line treatment, though recommended duration varied widely. Profound disagreement existed regarding the role of surgery, ranging from early operative intervention to complete rejection. Surgeons tended to frame nTOS as a mechanical compression disorder, whereas neurologists and rheumatologists frequently expressed diagnostic skepticism and favored prolonged conservative management. Orthopedic surgeons adopted selective surgical strategies focused on musculoskeletal contributors. Across specialties, variability was driven primarily by differing conceptual models of nTOS rather than by technical considerations.
Conclusion
Management variability in nTOS arises chiefly from divergent understandings of the condition itself. Without addressing these foundational differences, inconsistency in care is likely to persist. Interdisciplinary consensus-building that integrates anatomical, neurological, and pain-based frameworks is essential for developing coherent, patient-centered management pathways for nTOS.
Review Articles
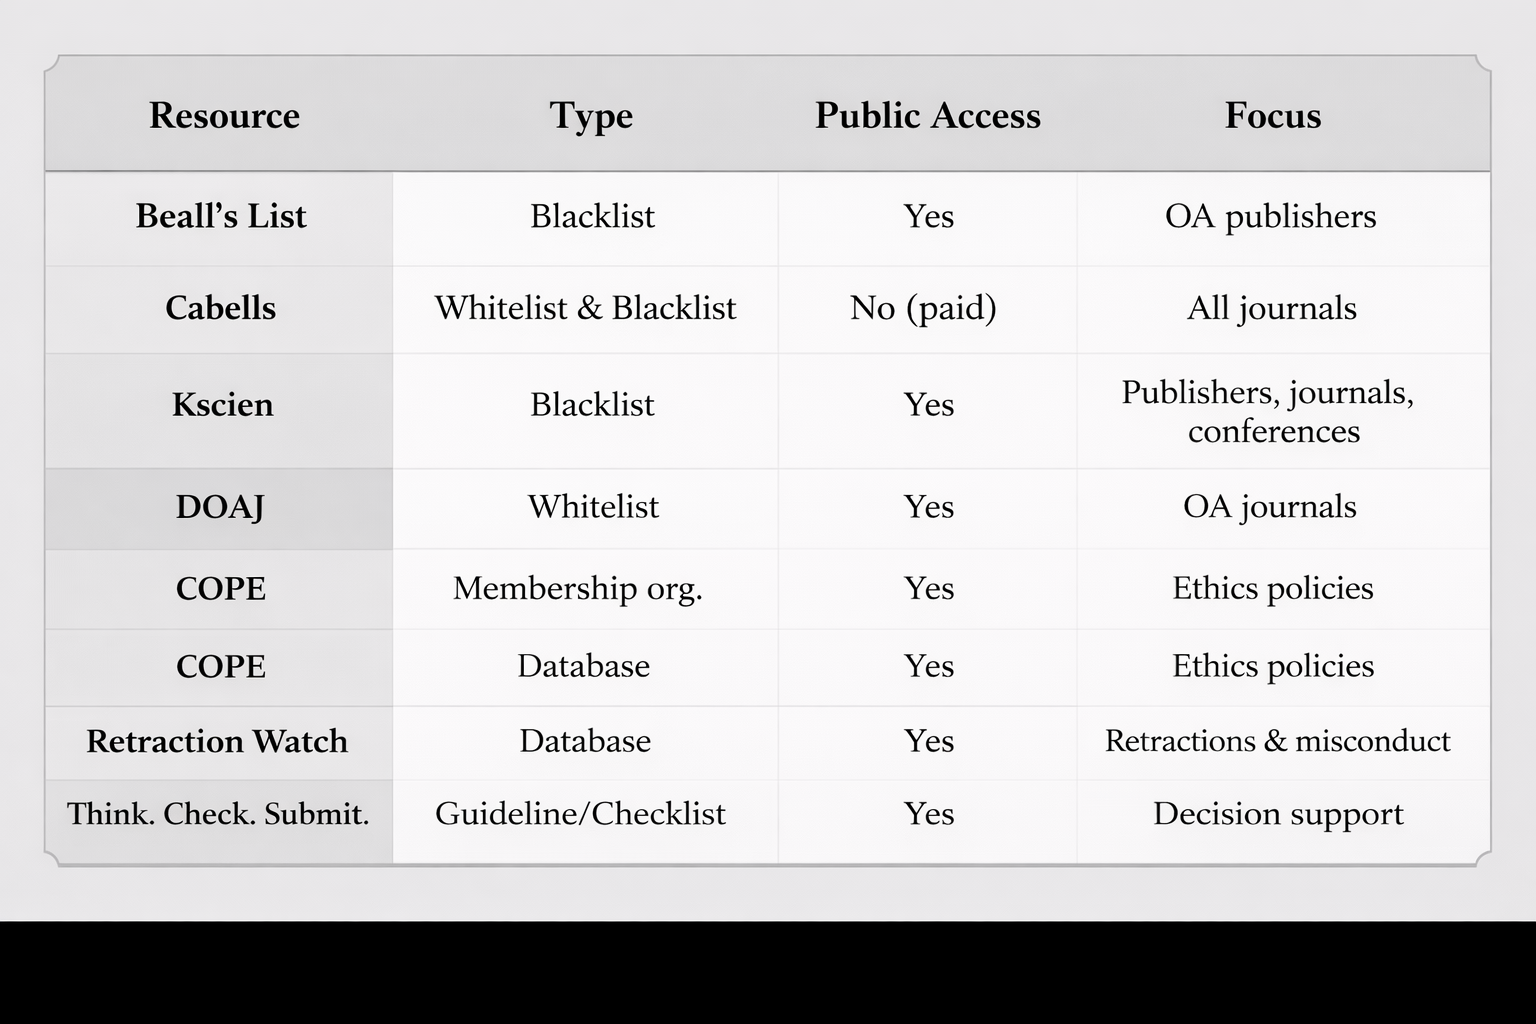
Renaming the Problem: Why ‘Non-Recommended Journals’ Is Preferable To ‘Predatory’ in Academic Publishing
Frederick M. Tiesenga, Daniel Rodger, Benjamin Saracco, Baichang Zhong, Andrea Cortegiani,...
(on the original article) This article has a Corrigendum. Please see the Corrigendum at: https://doi.org/10.58742/bmj.v4i1.225
The term "predatory journals" is widely used to describe publishing practices that exploit authors, compromise research quality, and mislead readers. Its use, however, has frequently led to legal threats and professional conflicts for individuals and institutions who call out such deceptive practices. Most notably, Jeffrey Beall, the creator of Beall’s List, faced legal threats and personal harassment, which ultimately led him to discontinue his work. To address these challenges, scholars have proposed replacing “predatory journals” with more neutral alternatives, such as “questionable journals”. This study recommends using the term “non-recommended journals,” which similarly avoids accusatory language while signaling the need for caution by scholars and institutions. By avoiding direct allegations of unethical conduct, the term "non-recommended" reduces the likelihood of legal repercussions and professional disputes. Adopting this terminology enables researchers and institutions to continue addressing concerns about low-quality or deceptive publishing practices while fostering a more constructive dialogue. This reframing encourages constructive dialogue, broader institutional engagement, and stronger collective efforts to uphold high ethical publishing standards and protect academic integrity.
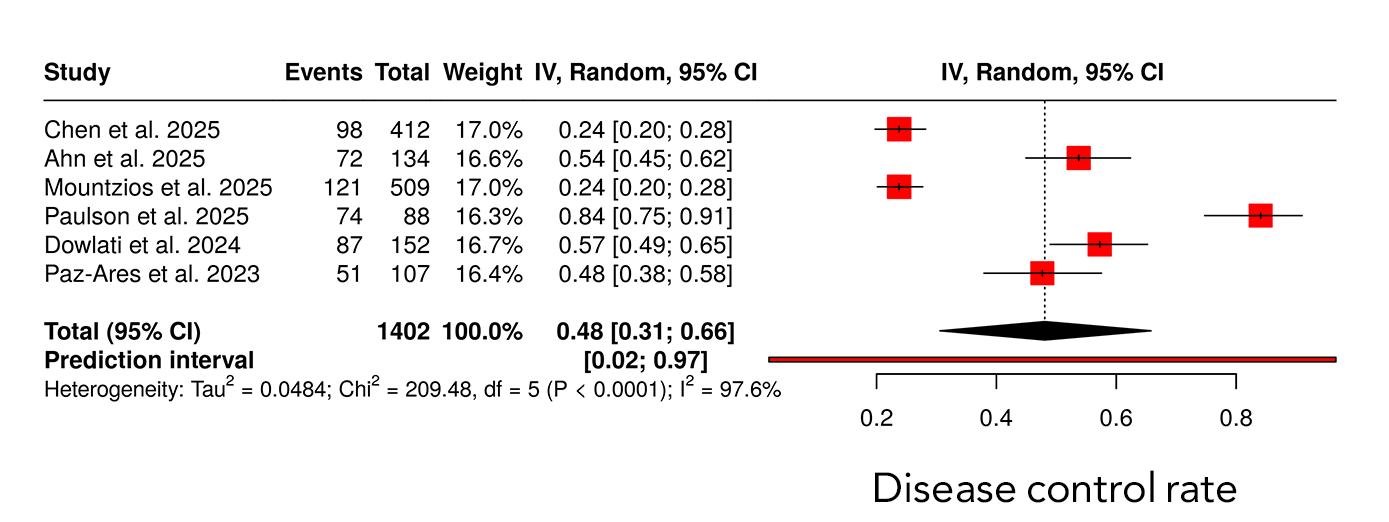
Small Cell Lung Cancer and Tarlatamab: A Meta-Analysis of Clinical Trials
Rebaz M. Ali, Karukh K. Mohammed, Sasan M. Ahmed, Kayhan A. Najar, Mohammed Q. Mustafa, Zanyar K....
Introduction
Tarlatamab is a Delta-like ligand 3 (DLL3) -directed bispecific T-cell engager recently approved for use in patients with advanced small cell lung cancer (SCLC) after progression on platinum-based therapy. This meta-analysis evaluated the efficacy and safety of tarlatamab as monotherapy and in combination regimens in the treatment of SCLC.
Methods
A systematic review and meta-analysis were conducted in accordance with PRISMA 2020 guidelines. PubMed/MEDLINE and EMBASE were searched from inception through September 2025 to identify clinical trials evaluating tarlatamab in SCLC. Eligible studies reported quantifiable efficacy and/or safety outcomes. Random-effects models were used to pool objective response rate (ORR) and disease control rate (DCR), and Kaplan–Meier methods were applied to assess survival outcomes.
Results
Seven clinical trials involving 1,247 patients with advanced SCLC were included. The pooled ORR was 0.42 (95% CI 0.31–0.54), with response rates ranging from 21–47% in monotherapy studies and up to 48% in combination regimens. Across six studies, pooled DCR was 0.48 (95% CI 0.31–0.66), with DCR reaching up to 87% in combination settings. Median progression-free survival ranged from 3.5 to 5.6 months, while median overall survival ranged from 13.2 to 25.3 months. Pooled time-to-event analyses demonstrated significant reductions in the risk of disease progression and death. Grade 3 and grade 4 adverse events occurred in 5.4% and 1.4% of patients, respectively, although safety reporting was incomplete in several studies.
Conclusion
Tarlatamab demonstrates clinically meaningful antitumor activity with an acceptable safety profile in heavily pretreated SCLC. These findings support DLL3-targeted therapy as a promising treatment strategy and warrant further prospective studies to define its optimal role in the evolving SCLC treatment landscape.
Case Reports
Early Onset of Coronary Subclavian Steal Syndrome: A Case Report and Literature Review
Jalal Gareeb, Farman J. Ahmed, Hemn H. Mohammad, Karokh F. Hamahussein, Soran H. Tahir, Sumaya...
Introduction
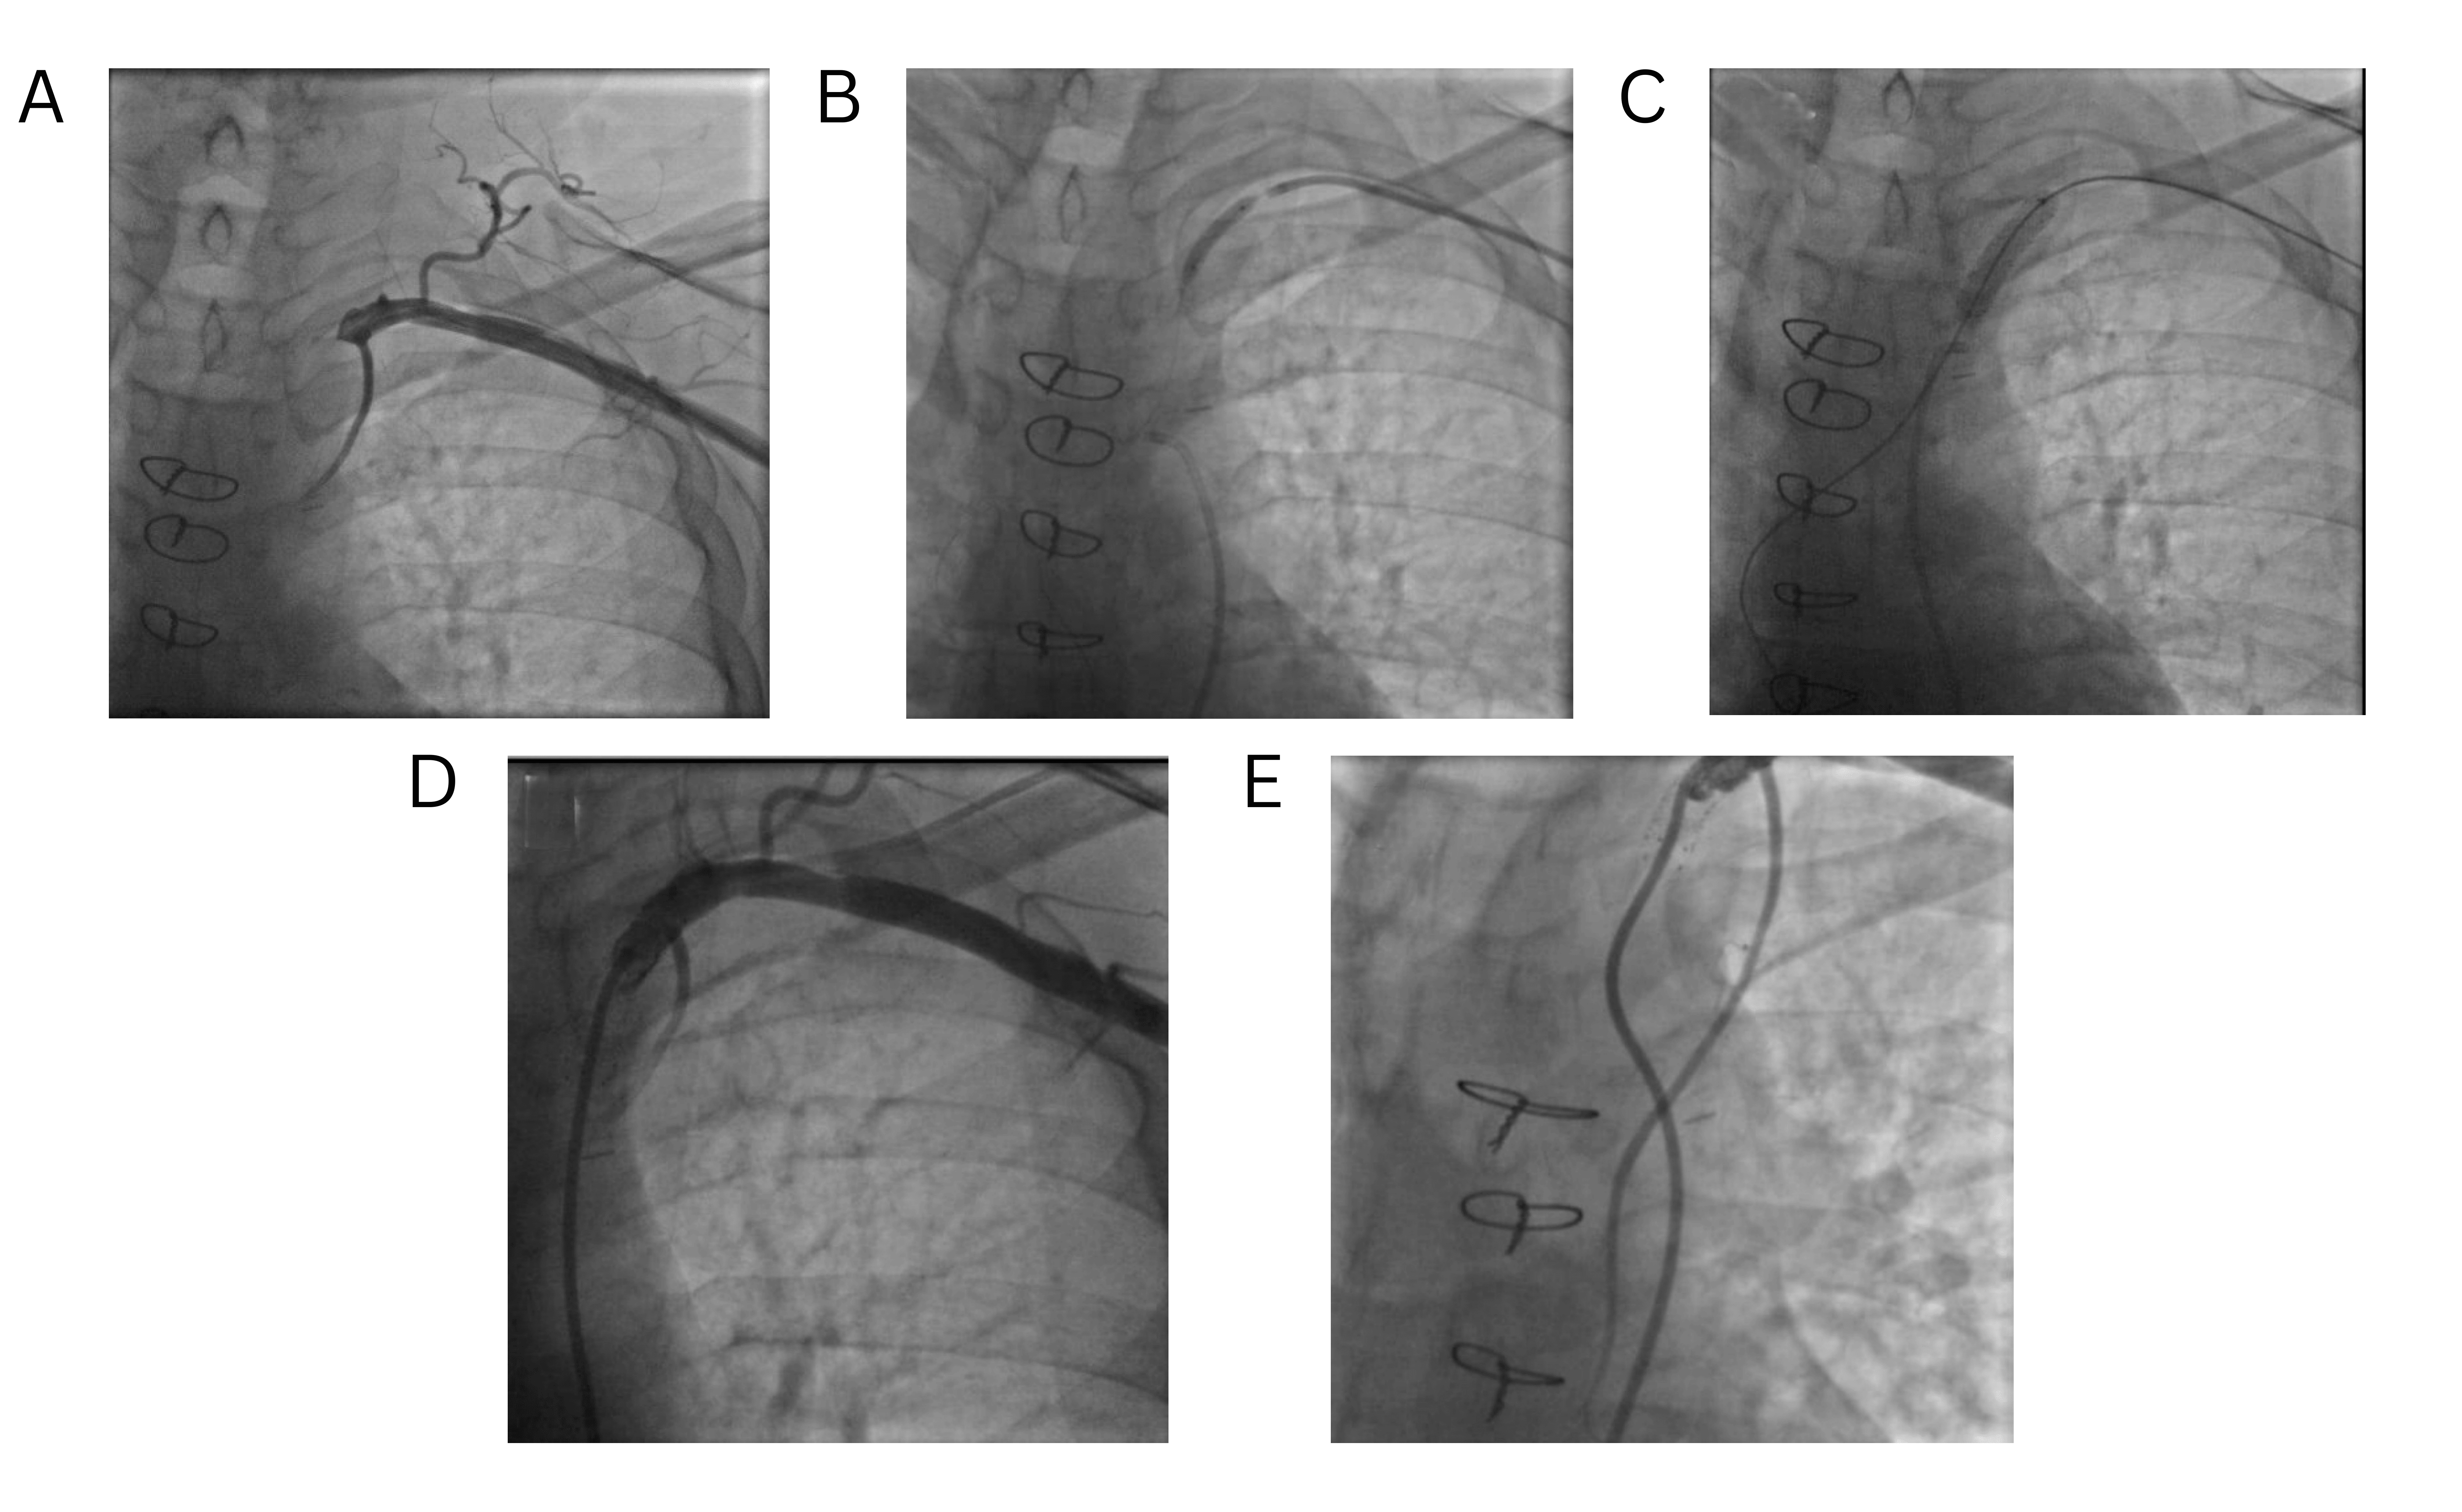
Coronary subclavian steal syndrome (CSSS) is a rare phenomenon that often goes undiagnosed and causes severe complications, including death. This report presents a case of CSSS with unexpectedly early presentation following coronary artery bypass grafting (CABG).
Case presentation
A 49-year-old male with diabetes, smoking history, and ischemic heart disease underwent CABG with a left internal mammary artery graft to the LAD and saphenous vein grafts. Three months later, he presented with exertional chest pain and left arm discomfort. Examination revealed a significant inter-arm blood pressure difference (right 140/90 mmHg, left 90/65 mmHg) and a diminished left radial pulse. Computed tomography angiography revealed complete proximal left subclavian artery occlusion with patent grafts. Percutaneous revascularization with balloon pre-dilatation and a 7.0 × 27 mm stent restored flow. The procedure was uneventful, and at 10-month follow-up, he remained asymptomatic with normalized arm pressures.
Literature review
A review of ten recent CSSS cases revealed a predominance of males (7/10), with ages ranging from 58 to 81 years. Comorbidities included cardiovascular, renal, and metabolic disorders. Chest pain was the most frequent presenting symptom. The interval from CABG to CSSS onset ranged from two days to 13 years. Management strategies encompassed percutaneous coronary interventions, nitrates, antihypertensives, and statins, with all patients achieving favorable outcomes.
Conclusion
Coronary subclavian steal syndrome can present shortly after CABG. Percutaneous endovascular stenting via a dual approach might offer good long-term outcomes.
Unusual Metastasis from Follicular Thyroid Carcinoma: A Case Report and Literature Review
Abdulwahid M. Salih, Deari A. Ismaeil, Rawa M. Ali, Ari M. Abdullah, Karzan M. Salih, Shko H....
Introduction
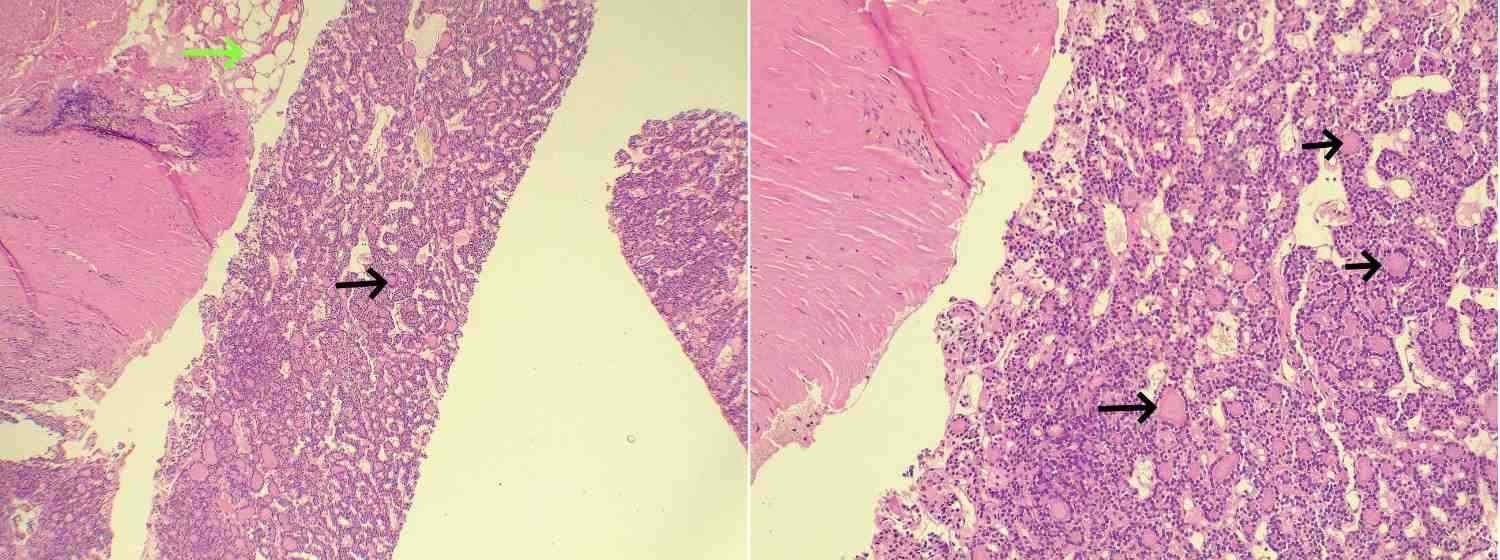
Follicular thyroid carcinoma (FTC) is a type of well-differentiated thyroid carcinoma. It has a poorer prognosis, is more metastatic, and has characteristics different from papillary thyroid carcinoma. It tends to metastasize hematogenously, usually to the bones and lungs. This study aims to present a rare case of FTC metastasis to the peritoneum and thigh of a patient with a literature review.
Case presentation
A 70-year-old patient presented with a right thigh mass. Magnetic resonance imaging of the right thigh revealed an intramedullary lesion in the femoral diaphysis. The thyroid gland was firm, with no evidence of enlargement. A computed tomography scan showed several peritoneal nodules. A core biopsy of the right upper femoral lesion and peritoneal mass was performed. Histopathologic findings and immunohistochemical analysis confirmed metastatic FTC with thyroid origin.
Literature review
Unlike widely invasive FTC, minimally invasive FTC has a better prognosis and is less metastatic. Imaging, histopathologic examination, and immunohistochemistry can help in arriving at a diagnosis of FTC. Mutations of PPAR-γ and RAS are associated with FTC. Radioiodine treatment and suppressive therapy for the thyroid-stimulating hormone have been shown to improve survival rates of FTC, with postoperative follow-ups and treatment being important.
Conclusion
Metastasis of FTC to the peritoneum is rare and could lead to a late diagnosis. Proper diagnosis with confirmatory tools such as immunohistochemistry and adequate treatment are critical.
Atypical Sigmoid Volvulus in an Adolescent: A Case Report and Literature Review
Dana T. Gharib, Dara Ahmed Mohammed, Araz Aziz Abdulla, Othman O. Qadr, Karokh F. Hama Hussein,...
Introduction
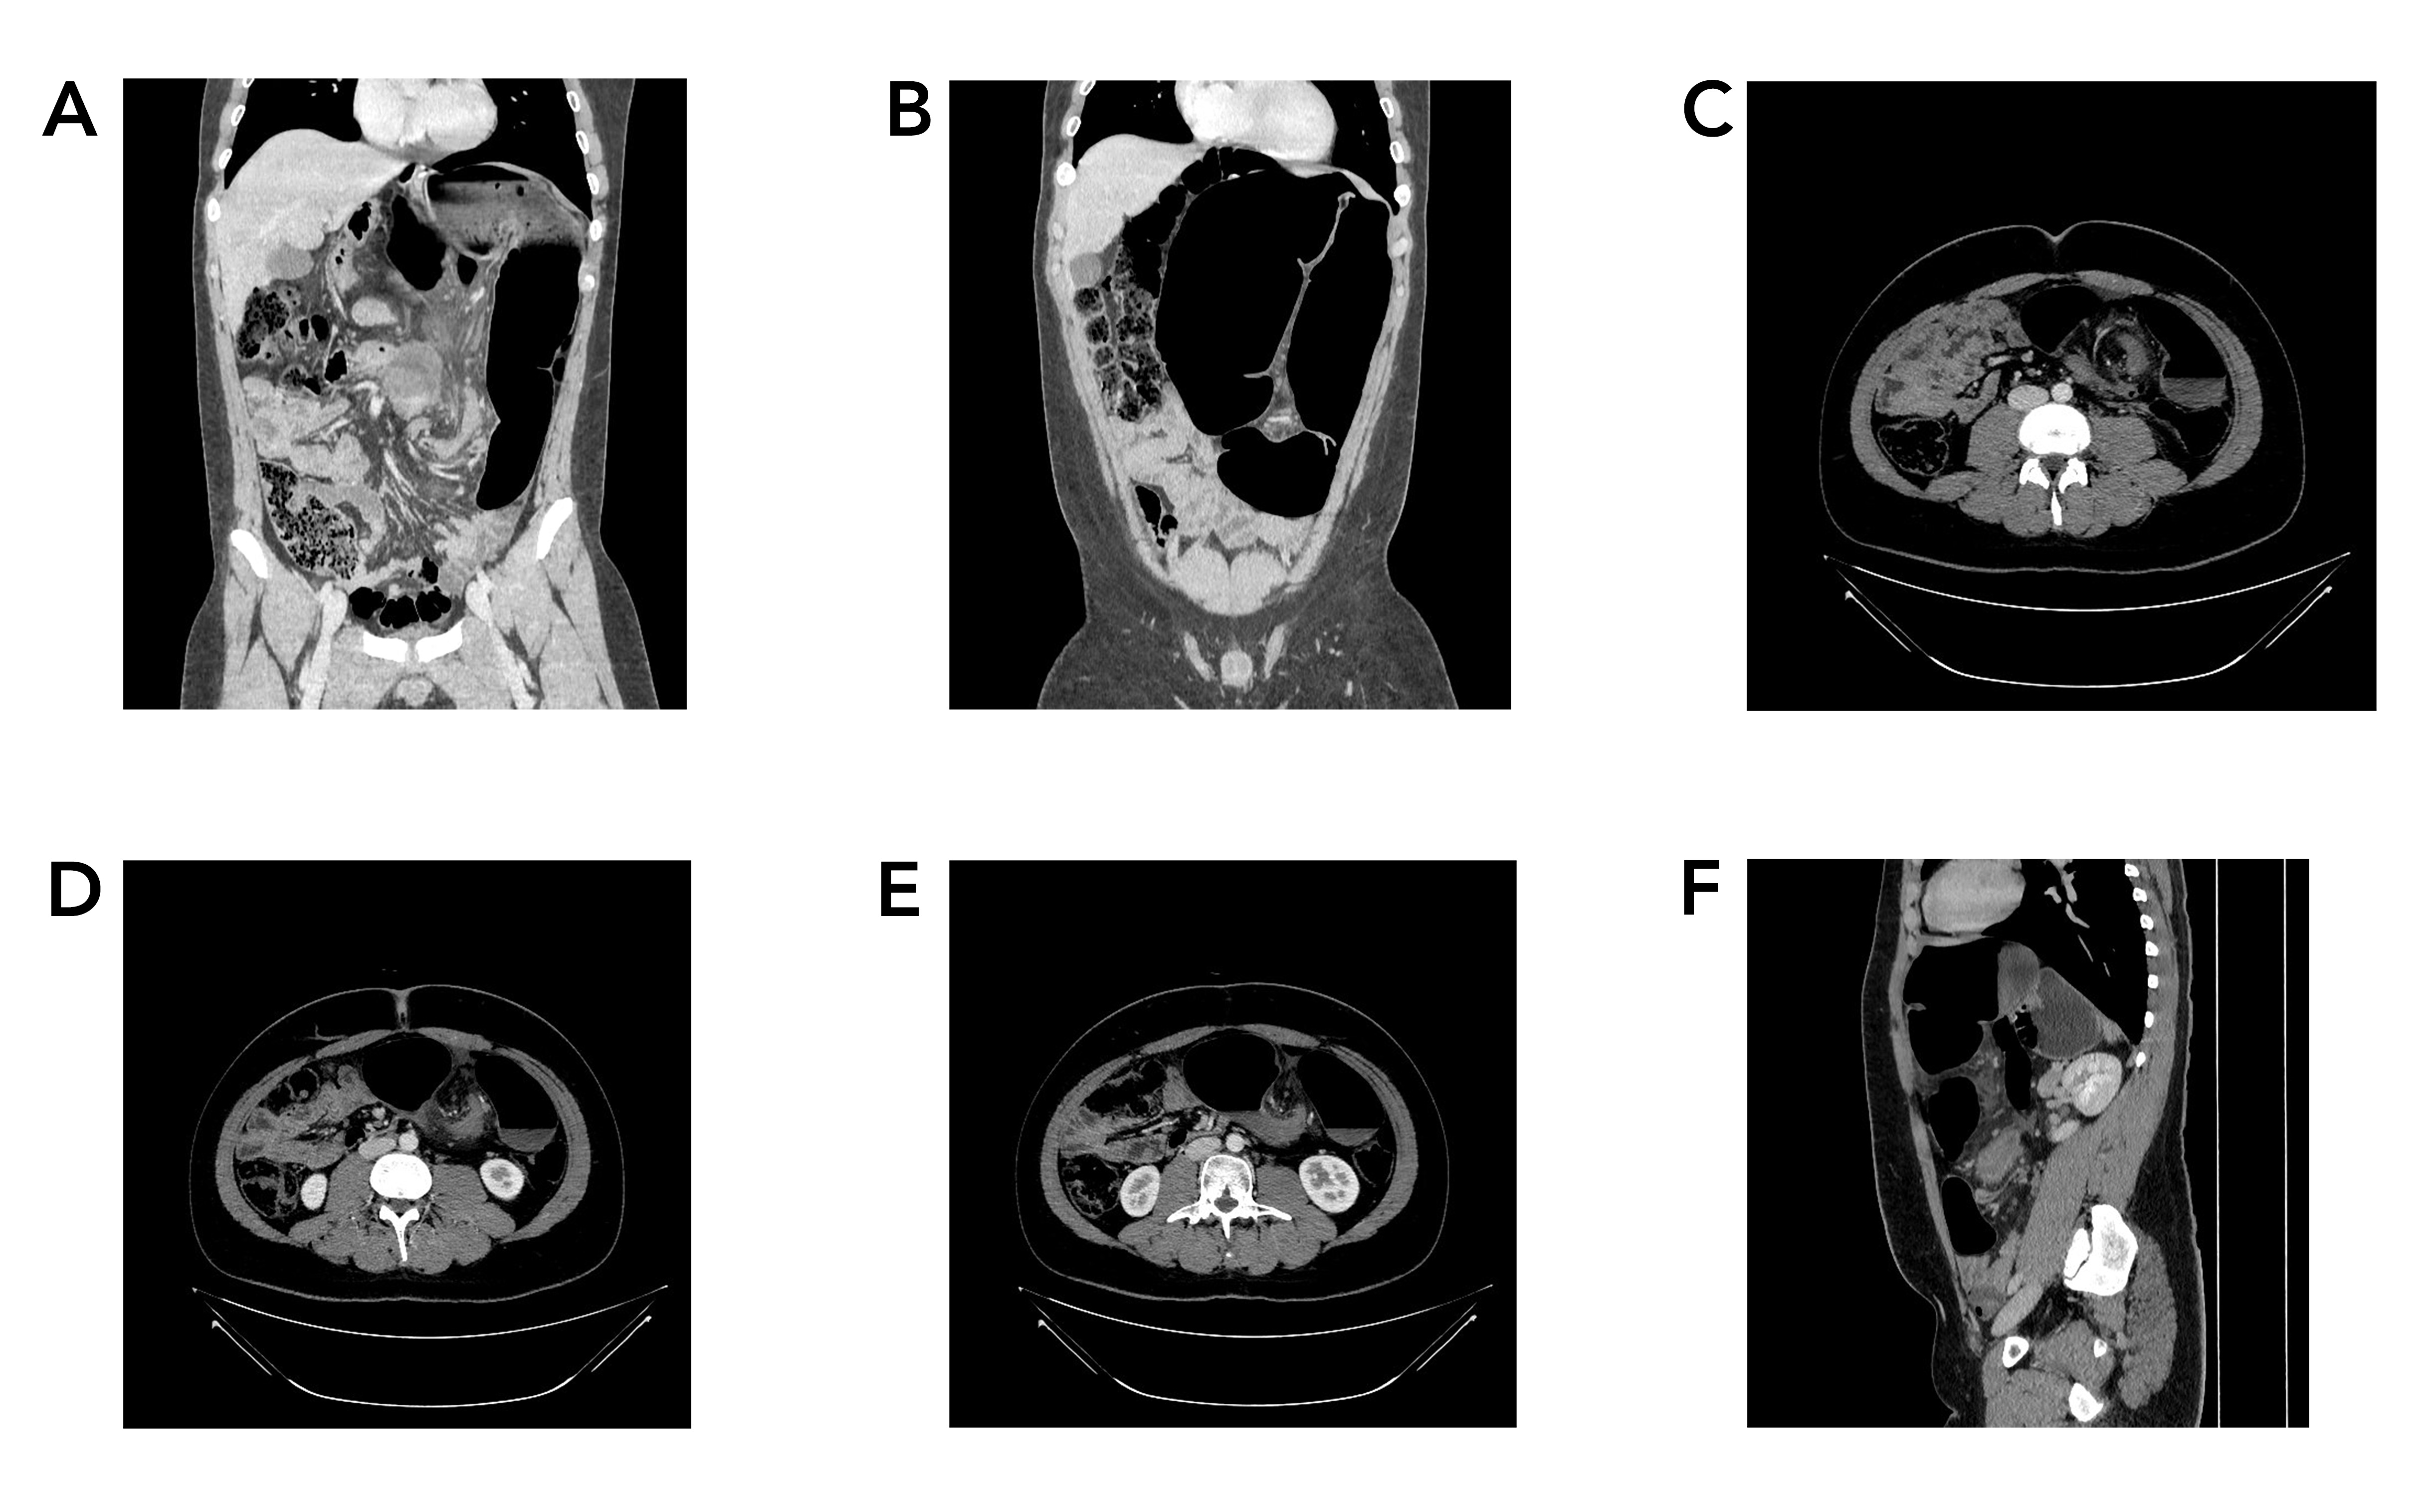
Sigmoid volvulus is an underrecognized diagnosis with potentially fatal outcomes in adolescents; the current study aims to present an adolescent with mild symptoms but was found to have extensive ischemic sigmoid volvulus.
Case presentation
An 18-year-old male complained of three days of moderate colicky abdominal pain, with decreased appetite and diarrhea. Physical examination revealed diffuse abdominal tenderness and exaggerated bowel sounds without abdominal distension. A contrast-enhanced computed tomography scan demonstrated evidence of twisting the sigmoid and a part of the left colon around each other but without signs of ischemia and perforation. Sigmoidoscopy showed volvulus with dusky ischemic mucosa. An immediate surgical intervention through Hartmann's procedure was performed. After three months of the operation, colostomy closure and colorectal re-anastomosis were performed.
Literature review
In a review of the literature, adolescents presented with symptoms of abdominal pain, swelling, vomiting, dehydration, and even shock in more severe cases. Despite the lack of data regarding the optimal long-term approach for sigmoid volvulus in adolescents, in a review of 63 cases, 77% of them received operative treatment, with sigmoidectomy being the predominant procedure. The total mortality rate was 6%, with an operative mortality rate of 8.1%.
Conclusion
Strangulated sigmoid volvulus should be considered in adolescents with abdominal pain despite having diarrhea and no clinically evident abdominal distention. Hartman’s procedure may result in a good outcome.
Retraction
Retraction Note: Arteriovenous Fistula Creation for Hemodialysis in Patients with End-Stage Renal Disease with and Without Surgical Drain: A Randomized Control Trial
Lokish S. Jaswel, Narayan Oste, Satish Vaidy
The Original Article was published on February 10, 2025
This article has been retracted at the request of the publisher (Barw Publisher) following an internal investigation. After publication, the journal was informed that the manuscript had been submitted without the final approval of all listed authors, which constitutes a breach of the journal’s authorship and publication ethics policies. Multiple attempts were made to contact the corresponding author to clarify this issue; however, no response was received. Following discussion between the publisher and the Editor-in-Chief, a decision was made to retract the article in order to maintain the integrity of the scientific record.
The Editor-in-Chief and the publisher regret any inconvenience caused to readers.